Student Achievement Indicator of Post-College Success: Employment
Post-College Success: Employment
Cumulative Percentage (2018-2020 Entry Year) of Professional-Technical Students Who Are Employed Within Four Years of Entry, for Shoreline and Regional Peer Group
|
|
Shoreline |
Regional Peers
|
Difference |
|
Total |
66.5% |
68.7% |
-2.2% |
|
|
|
|
|
|
Race/Ethnicity |
|
|
|
|
American Indian or Alaska Native |
** |
** |
** |
|
Asian |
74.1% |
70.6% |
3.4% |
|
Black or African American |
44.4% |
69.8% |
-25.4% |
|
Hispanic or Latino |
71.3% |
70.0% |
1.3% |
|
Native Hawaiian or Other Pacific Islander |
** |
** |
** |
|
White |
68.2% |
70.0% |
-1.8% |
|
2+ Races |
66.0% |
65.5% |
0.6% |
|
Not Reported |
67.6% |
63.4% |
4.2% |
|
|
|
|
|
|
Age Group |
|
|
|
|
0-19 |
76.0% |
75.5% |
0.5% |
|
20-24 |
68.8% |
69.2% |
-0.5% |
|
25-29 |
65.2% |
69.0% |
-3.8% |
|
30-39 |
63.7% |
70.6% |
-6.9% |
|
40+ |
56.7% |
60.5% |
-3.9% |
|
Not Reported |
** |
** |
|
|
|
|
|
|
|
Gender |
|
|
|
|
Female |
65.5% |
70.4% |
-4.9% |
|
Male |
68.6% |
67.0% |
1.6% |
|
X |
N/A |
N/A |
N/A |
|
Unknown |
62.1% |
63.6% |
-1.6% |
|
|
|
|
|
|
First Generation Status |
|
|
|
|
[Data on First Generation Status not available prior to 2021] |
|||
|
|
|
|
|
|
Received Need-Based Aid |
|
|
|
|
Received Need-Based Aid |
56.4% |
71.1% |
-14.7% |
|
Did Not Receive Need-Based Aid |
71.8% |
67.5% |
4.4% |
NA – Data not tracked
**insufficient number of students in the cohort to meet SBCTC minimum threshold of
10 for reporting
Post-College Success: Employment
Cumulative Percentage (2017-2019 Entry Year) of Professional-Technical Students Who Are Employed Within Four Years of Entry, for Shoreline and Regional Peer Group
|
|
Shoreline |
Regional Peers
|
Difference |
|
Total |
62.9% |
68.1% |
-5.2% |
|
|
|
|
|
|
Race/Ethnicity |
|
|
|
|
American Indian or Alaska Native |
** |
** |
** |
|
Asian |
75.4% |
69.0% |
6.4% |
|
Black or African American |
45.6% |
70.7% |
-25.0% |
|
Hispanic or Latino |
76.6% |
69.6% |
6.9% |
|
Native Hawaiian or Other Pacific Islander |
** |
** |
** |
|
White |
62.5% |
68.5% |
-5.9% |
|
2+ Races |
61.6% |
66.2% |
-4.6% |
|
Not Reported |
61.5% |
66.2% |
-4.7% |
|
|
|
|
|
|
Age Group |
|
|
|
|
0-19 |
74.5% |
76.2% |
-1.7% |
|
20-24 |
64.7% |
69.0% |
-4.3% |
|
25-29 |
59.9% |
69.2% |
-9.2% |
|
30-39 |
62.0% |
69.4% |
-7.4% |
|
40+ |
50.0% |
57.8% |
-7.8% |
|
Not Reported |
** |
** |
|
|
|
|
|
|
|
Gender |
|
|
|
|
Female |
61.8% |
68.9% |
-7.1% |
|
Male |
64.9% |
67.4% |
-2.5% |
|
X |
N/A |
N/A |
N/A |
|
Unknown |
57.7% |
56.0% |
1.7% |
|
|
|
|
|
|
First Generation Status |
|
|
|
|
[Data on First Generation Status not available prior to 2021] |
|||
|
|
|
|
|
|
Received Need-Based Aid |
|
|
|
|
Received Need-Based Aid |
69.3% |
68.3% |
1.0% |
|
Did Not Receive Need-Based Aid |
52.6% |
67.6% |
-15.0% |
NA – Data not tracked
**insufficient number of students in the cohort to meet SBCTC minimum threshold of
10 for reporting
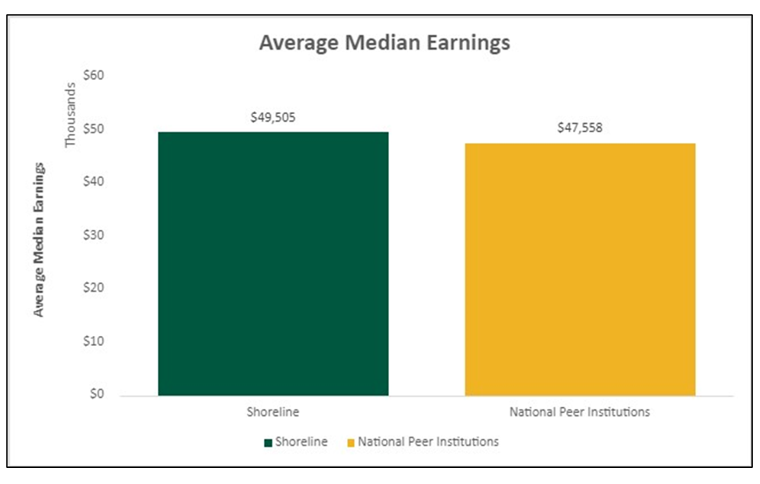
Median Earnings: the Median Annual Earnings of Individuals Who Received Federal Student Aid and Began College at Shoreline 10 Years Ago, Regardless of Their Completion Status
|
Median Earnings |
Shoreline |
National Peers Average Median |
Difference |
|
|
$49,505 |
$47,558 |
+$1,947 |